This page will contain step-by-step instructions for digitizing a riverscape in QGIS. Under each section will be the type of shapefile, the name for that shapefile, and fields for the shapefile. Keep in mind that these fields are the minimum and project-specific demands may require additional fields. If the project is a large digitizing effort it may be beneficial to have one technician generate a series of blank shapefiles to distribute so that other technicians can copy and paste those shapefiles into their projects. This can help ensure consistency across shapefiles and decrease errors with field types. This first section will detail useful plugins and the basic mechanics of using QGIS to avoid redundancy in later sections where we will go in-depth on how to digitize each layer.
For a cheat sheet that only contains field names and types, see here. This webmap has some good examples of mapping. Caveats abound, they are detailed here.
Using QGIS to Digitize Riverscapes
An important element of high-quality digitized data is maintaining a consistent scale. This means that once you begin digitizing a layer at 1:500 for example, the rest of that layer must be digitized at 1:500 scale. You can zoom in and out a little bit if you need better context but avoid digitizing at a variety of scales. This does not mean you have to use the same scale for the entire project, you only have to maintain that scale for the layer you are working on.
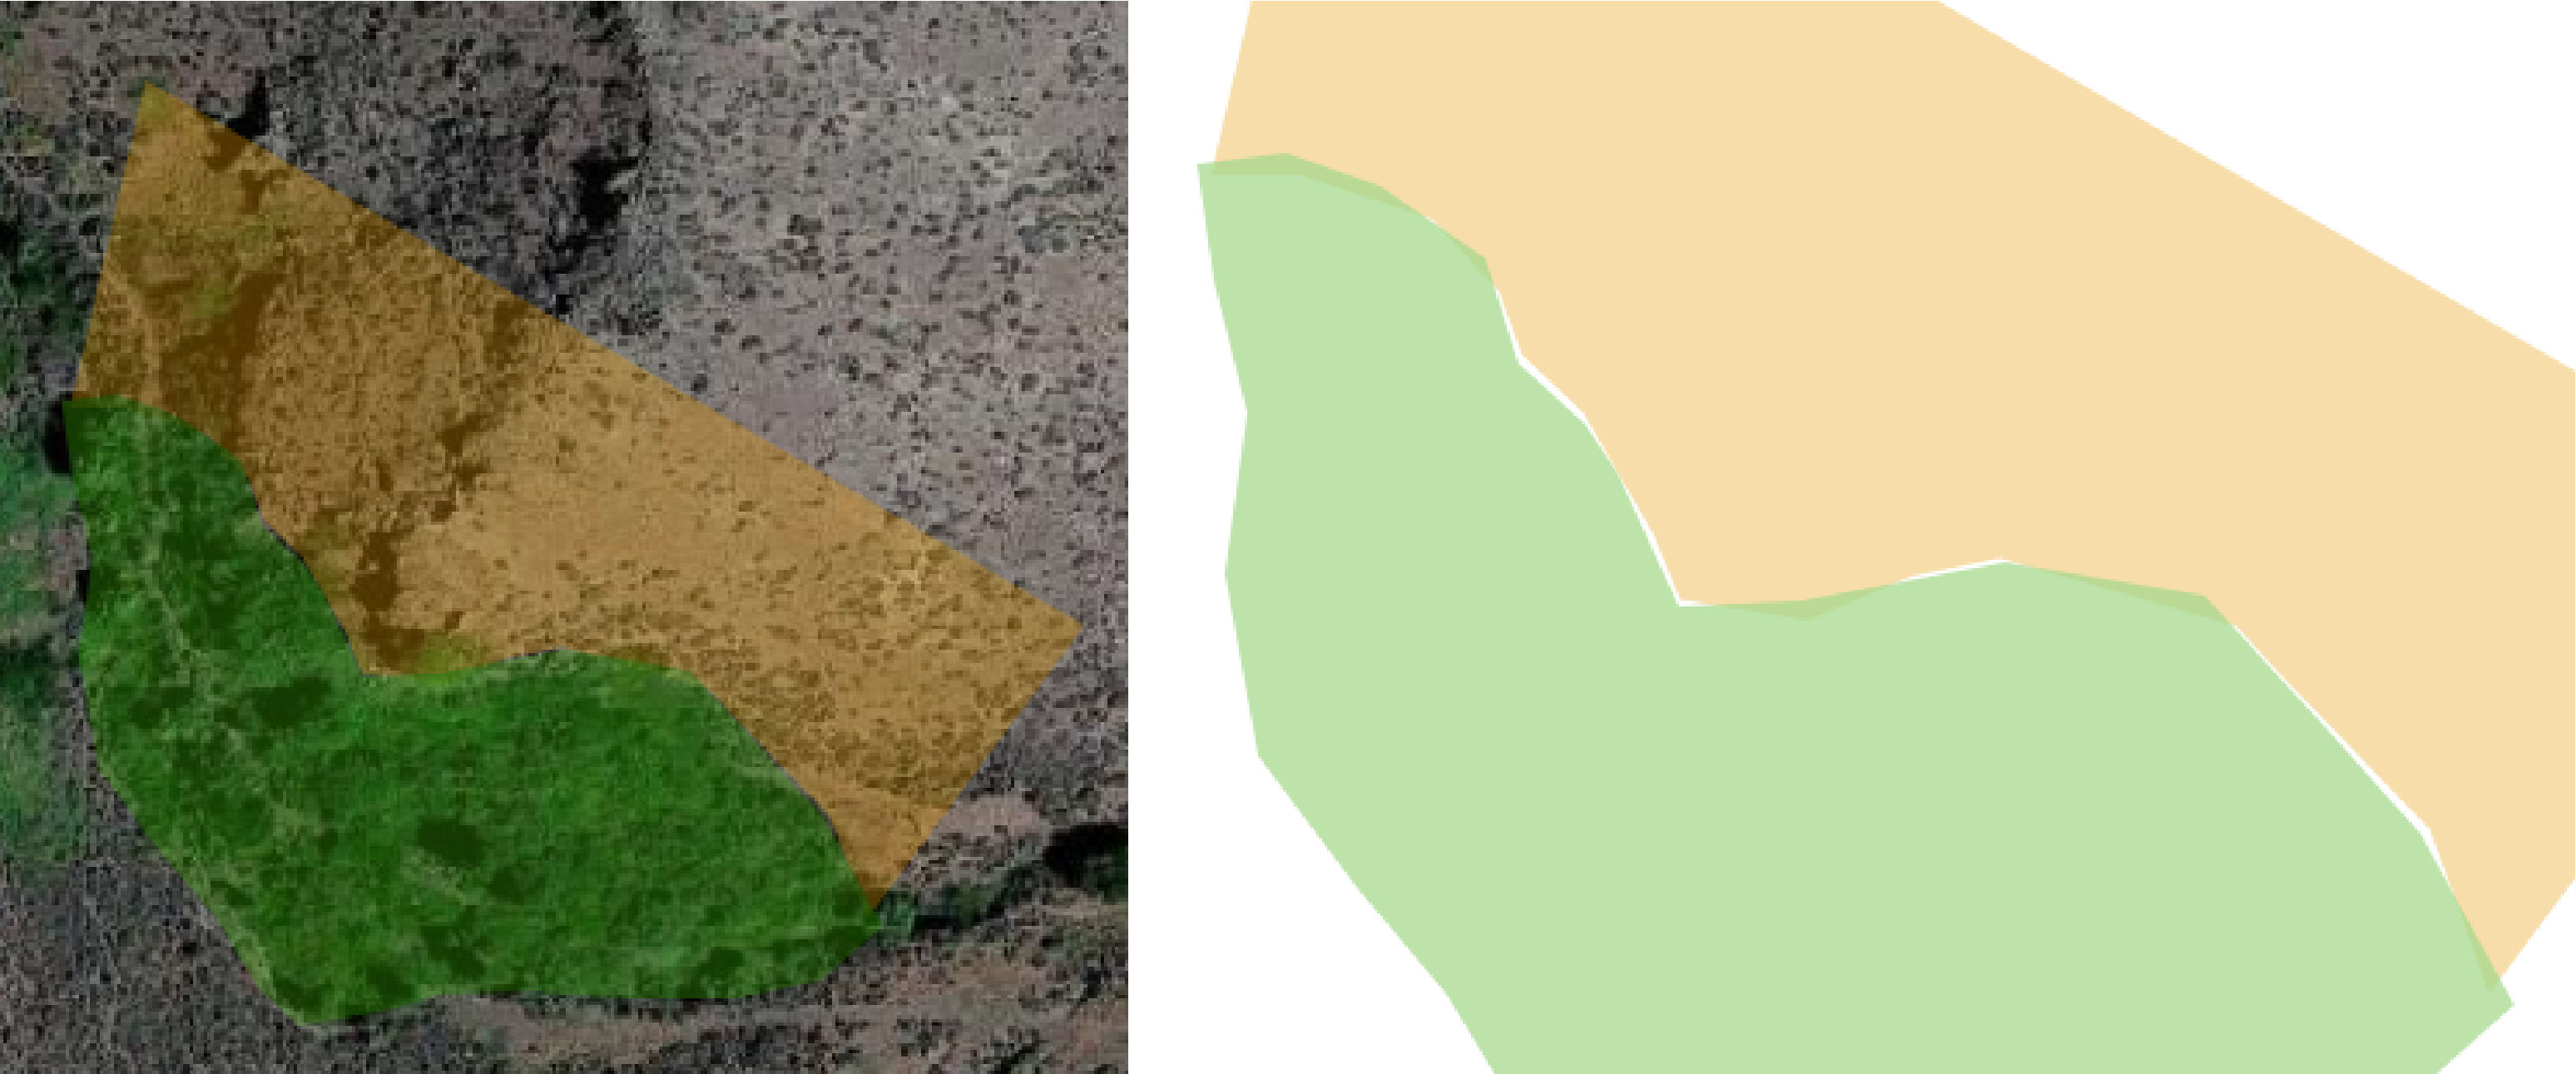
Another consideration is to avoid “spaghetti digitizing”. This is where the digitizer does not use snapping and tracing and little holes get left behind that from far away, are not visible, but once you zoom in they become clear. In the example below you can see that the polygons have gaps between them in some places and overlap in others when they should touch but not overlap.
Some useful plugins to install before digitizing are “Clipper” and “Locate points along lines”. Toolbars you’ll want to have enabled are Digitizing, Advanced Digitizing, Plugins Toolbar (clipper), Locate Lines (locate points along lines), and Snapping. To enable toolbars, find view then toolbars or right-click on the toolbars that are already enabled to see more.
Shapefile Creation and Editing
Click on  to create a shapefile.
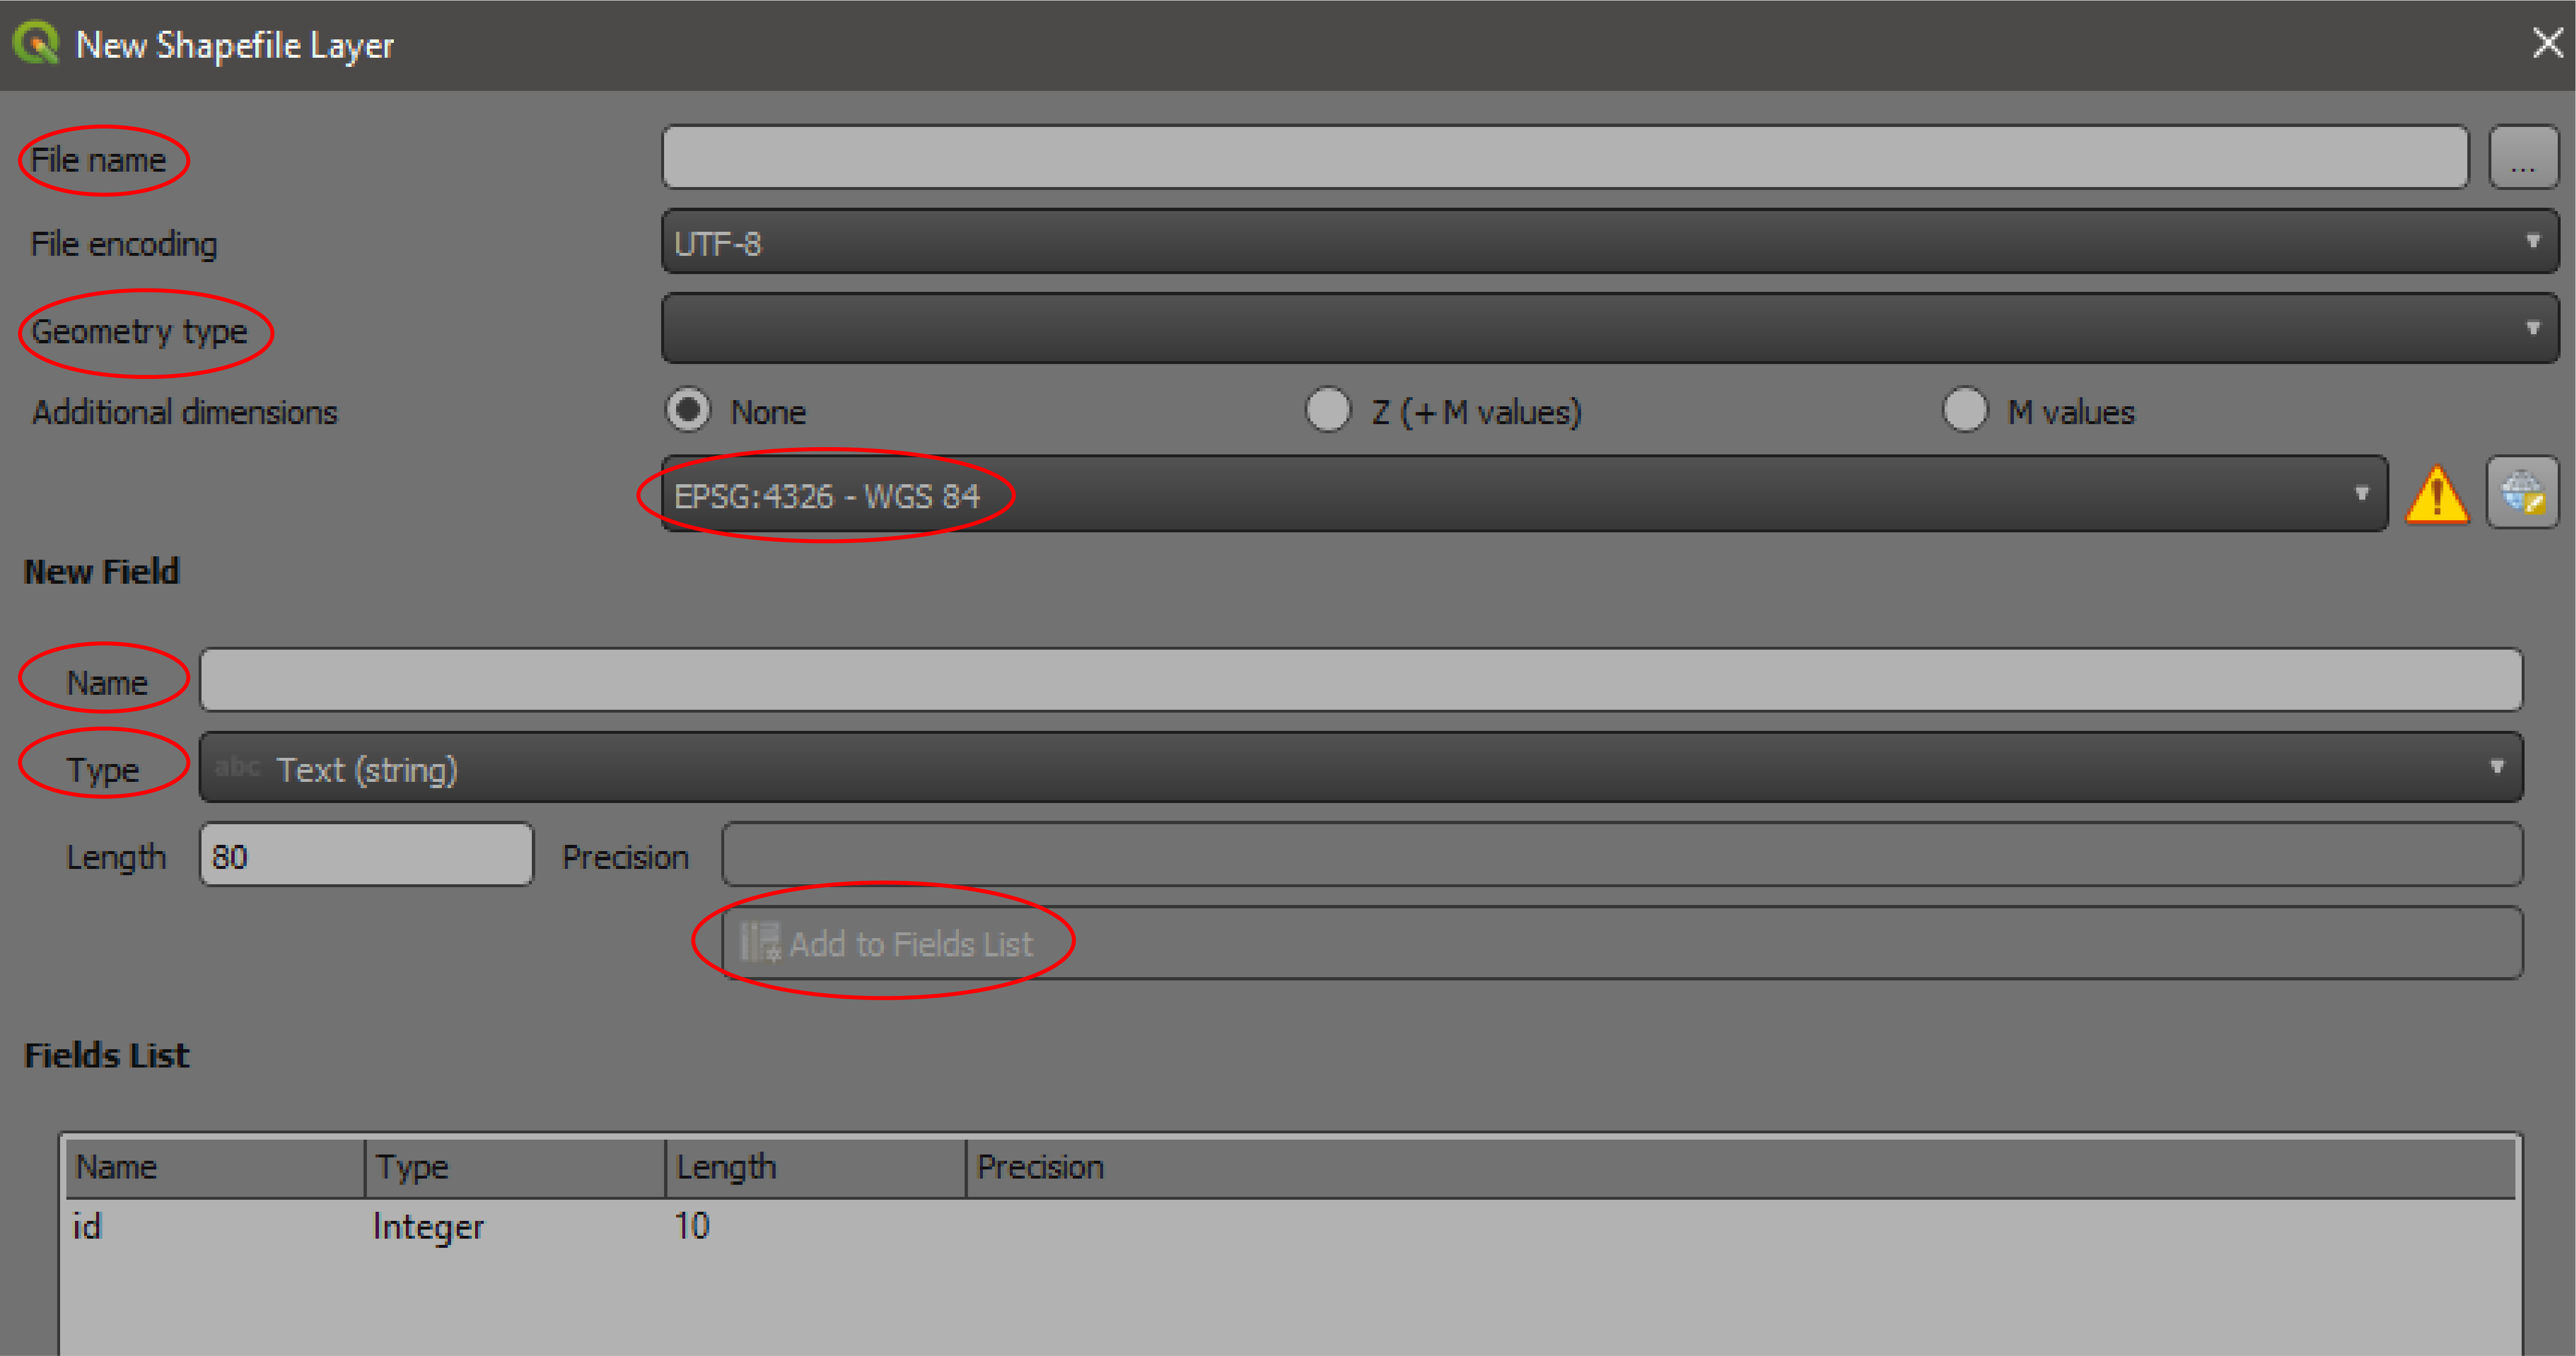
From here name your shapefile and choose its save location then select which type of shapefile you want, polygon, line, or point. Select an appropriate coordinate system for your site this will generally be NAD83/UTM zone ___. Adding fields can be done by naming the field, selecting what type of field it is, and then once that is filled out, clicking the “Add to Fields List” button. If you forget to add fields in this step, you can also do it from the field calculator after you finish creating the shapefile.
To begin an edit session, select the add feature button. This will look different depending on whether you are working on a polygon, line, or point. 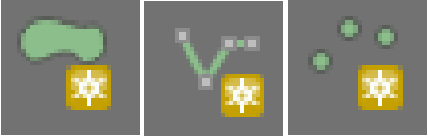
Field Calculation
To calculate fields click on the shapefile you want to calculate for and then either in the attribute table or the ribbon click on  . Here you can create a field if you didn’t during the shapefile creation step or “Update existing field”. Select the field you’d like to calculate and enter the formula needed. Once that formula is entered, click “OK” and the fields will be calculated. The following is a list of useful formulas that you will likely be using:
area($geometry) - will calculate area in CRS units
length($geometry) - will calculate length in CRS units
now() - the date and time at that moment
$y - will calculate the latitude
$x - will calculate the longitude
$area - will calculate the area in the project’s units NOT the CRS units
$length - will calculate length in the project’s units NOT the CRS units
A note on Strings : you can use the field calculator to fill cells with text but the letters need to be within quote marks i.e. ‘ PUT TEXT HERE ‘
If you use area($geometry) or length($geometry), which is what I recommend, then these fields will be calculated using the coordinate system’s units. You can check what units your CRS uses by looking it up through a search engine or by double clicking the layer to open the layer properties, then going to information, and under the Coordinate Reference Section (CRS) section the units will be shown. Ensure that the units your CRS uses are meters because that’s what we generally use for digitizing units, NAD83/UTM Zone ___ uses meters. If your project needs to be in different units, use the appropriate CRS and change the area_sq_m column to be more representative of what you are using. You can also use $area and $length to calculate using units that you can set under Project > Properties > General > Measurements. If you choose this method be careful to make sure that QGIS doesn’t change which units it’s using.
Symbology
There is a standard set of symbology we use in the lab to ensure all our data looks consistent. This symbology can be found at 0_ET_AL\NonProject\etal_Symbology. They are named according to the layer they should be used for. To apply this symbology, navigate to the properties of the shapefile you are symbolizing. You can do this by double-clicking on the shapefile in your layer pane. Then, regardless of which tab you are on in the bottom left should be a dropdown that says style. From here, click load style then navigate to the directory outlined above. Select the appropriate QGIS Layer setting, then click load style, then click OK. The shapefile should now be symbolized.
Geopackaging
Once you’ve finished digitizing the riverscape, calculating the fields, and applying the proper symbology, you’ll need to save all these shapefiles as a geopackage. This allows a user to load in all the layers at once and properly symbolized rather than unsymbolized shapefiles one at a time. To package shapefiles, use the “Package Layers” tool from QGIS. You’ll select all your layers in inputs and then select where you want it saved and the name. Then run, and now you’ve created a geopackage!
Metadata
This metadata template is a good baseline to build your metadata off of. While you may not need the geomorphic units and transects sections you can use the following template as a base to build your project metadata on:
- Name: Your name
- Date: The date you started digitizing
- Has the digitizer been to the site?: You’ll state yes or no regarding whether you’ve been to the site or not
- Lines of evidence: List your lines of evidence in digitizing. This refers to the sorts of imagery, rasters, and shapefiles you used to get more context of the site (i.e. 10m DEM, Google Earth, high-res orthoimage)
- Scale: For each layer, you’ll denote what scale you used for digitizing
- Confidence of accuracy: How confident are you that your mapping is accurate; low, medium, or high? The confidence of accuracy is also a good place to list what reasons you had for your confidence level.
For creating FGDC CSDGM formatted metadata there are tools in both Arc and QGIS that can help and this website. This style of metadata will generally only be necessary if the data you create will end up in a government database. This means that unless you’re told to create this specifically, just use the template above.